E-textile Based Imaging Array:
Final Phase
Introduction
This web page describes the work done on the final phase of the
project and the results obtained. We have compared the performance
and power consumption of the three routing algorithms.
Comparison of Routing Algorithms
Flooding vs. Ring Algorithm
Both the flooding and the ring algorithm were used in ID map formation
step (Step 2) of the image array algorithm
Performance
Table 1 shows the time taken for the individual nodes to complete
the ID map forming step for both flooding and ring algorithms. Not
all the nodes in the flooding case were able to complete the ID
map before the batteries for the nodes are depleted. Clearly, the
flooding algorithm is not suitable.
Figure 1 shows the cumulative time taken for the number of nodes
that complete the ID map.
| Flooding |
Ring |
| Node ID |
Time taken (sec) |
Node ID |
Time taken (sec) |
| 14 |
0.411443 |
8 |
0.172628 |
| 13 |
0.421562 |
13 |
0.19577 |
| 19 |
0.49638 |
9 |
0.195778 |
| 18 |
0.503121 |
12 |
0.204218 |
| 12 |
0.551108 |
14 |
0.205012 |
| 7 |
0.724927 |
17 |
0.228353 |
| 11 |
0.727103 |
19 |
0.230589 |
| 8 |
0.758391 |
7 |
0.240746 |
| 6 |
0.775167 |
18 |
0.263761 |
| 2 |
0.826725 |
10 |
0.289727 |
| 20 |
0.827247 |
24 |
0.290753 |
| 9 |
0.839707 |
16 |
0.290804 |
| 1 |
0.852532 |
15 |
0.294659 |
| 3 |
0.971233 |
23 |
0.295735 |
| 17 |
0.98721 |
11 |
0.297355 |
| 22 |
1.094035 |
6 |
0.319901 |
| 23 |
1.415957 |
2 |
0.347763 |
| 24 |
2.010461 |
3 |
0.368582 |
| |
|
20 |
0.37821 |
| |
|
25 |
0.420266 |
| |
|
22 |
0.428763 |
| |
|
5 |
0.42998 |
| |
|
4 |
0.448707 |
| |
|
1 |
0.470458 |
| |
|
21 |
0.55273 |
 |
Figure 1
Time taken to form ID map (flooding vs ring)
|
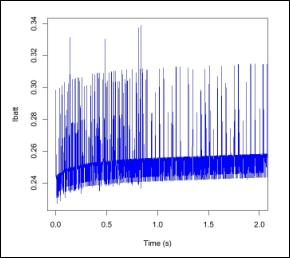
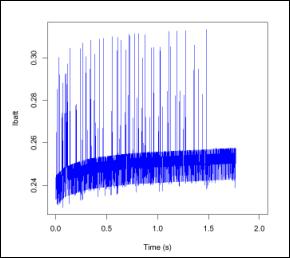
Power
Figures 2 and 3 shows the battery current utilization for one of
the nodes (Node 1) for the two routing algorithms respectively.
Although the difference is not very significant, it can be seen
that there are more high instantaneous values for the flooding case.
Thus in terms of power utilization, the ring algorithm would also
be a better option.
|
Figure 2
Battery current for flooding algorithm |
|
Figure 3
Battery current for ring algorithm |
Ring vs. Fixed Routing Algorithm
The ring algorithm has also been compared against the fixed routing
algorithm in terms of performance and power utilization. The ring
algorithm has been used for the ID map formation step (Step 2) in
both cases. The fixed algorithm is only used for the image forming
step (Step 3). Thus the two cases for comparison are “ring-ring”
and “ring-fixed”, as labeled in the diagrams.
Performance
The “quality” of the image formed is used as a comparison
for performance. Samples of the image are collected at periodic
intervals. A value for a node in the image sample represents the
absolute time that the sensor data was produced. There are two criterion
used to compare performance. The first is “image coherence”
which is the standard deviation of the times for the 25 nodes in
the image. The second measure is the “image timeliness”
which is the difference between the value for Node 13 (the collector
for the sensor data from all nodes) and the mean of the values of
all the nodes in the image. Node 13 will always be the most updated
since it is forming the image.
Note that a “coherent” image may not necessarily be
the most updated.
Figures 4 and 5 shows the “image coherence” and “image
timeliness” respectively. As can be seen, the fixed routing
algorithm has performed better than the ring algorithm, both in
terms of coherence and timeliness.
 |
Figure 4
Image coherence |
 |
Figure 5
Image timeliness |
Power
Figure 6 shows the battery drainage for the both cases. The data
obtained represents the sum of the battery remain energies for all
25 nodes in the array. Although the difference is not significant,
it can been seen that the ring algorithm is draining battery energy
faster than the fixed algorithm.
 |
Figure 6
Battery energy utilization |
Conclusion
In this project, we have implemented a workable version of the 25-node
imaging array. Most of the work done is on setting up the underlying
communication network in the e-textile. 3 different routing algorithms,
flooding, ring and fixed, have been implemented and compared in terms
of performance and power utilization.
From this project, we can see that there are many implementation
considerations when trying to implement an e-textile based imaging
array. One of the main considerations is the routing algorithm used
to form the ID map and the sensor image. The results showed that
the quality of the image formed may not be very high, as a result
of network latencies. Without efficient routing algorithms, both
in terms of performance and power consumption, such e-textile based
imaging array may be limited to lower end applications.
To achieve power efficiency and fault tolerance required by the
e-textile based imaging array, more work need to be done to optimize
the communications protocol and routing algorithms. This is particularly
important when the imaging array is increased in size.
References
[1] “A Survey of Technologies for Smart Fabrics(Computational
Textiles), DRAFT, Summer 2001”, Phillip Stanley-Marbell
[2] “Project proposal, E-Textile-based Ultra-sound Imaging
Array”, Seng Teck, Sing & Chee Wan, Teng
[3] “Project Report Phase 1, E-Textile-based Ultra-sound Imaging
Array”, Seng Teck, Sing & Chee Wan, Teng
[4] “Project Report Phase 2, E-Textile-based Ultra-sound Imaging
Array”, Seng Teck, Sing & Chee Wan, Teng
[5] “Project Report Phase 3, E-Textile-based Ultra-sound Imaging
Array”
[6] “Myrmigki Simulator Manual, Release 0.1.ece743”,
Philip Stanley-Marbell.
|
