|
Private |
E-textile Based Imaging Array: Phase FourIntroductionThis web page describes the work done on the fourth phase of the project and the results obtained. We have successfully implemented the fixed routing algorithm for the sending of sensor data. The node in the center of the array, Node 13, has been designated as the single collection point of all the sensor data and to form the image. We have also collected some preliminary power statistics.
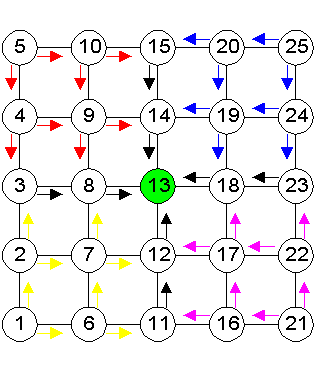
Work DoneThe Fixed Routing AlgorithmFigure 1 shows how the fixed routing algorithm works. Node 13 is designated to be the node to form the sensor image. The array will be divided into four quadrants. Nodes in the quadrants will send packets to the two axes, which separate the quadrants. The nodes on axes will then relay the packets to the center node in the array. The fixed routing algorithm was successfully implemented.
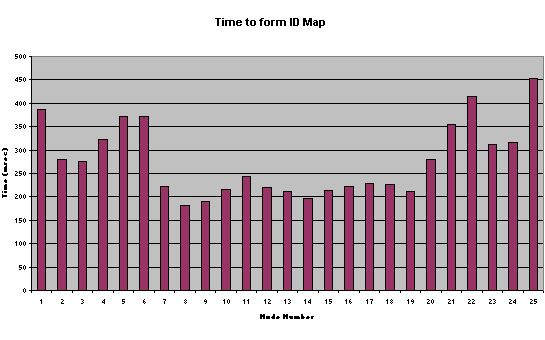
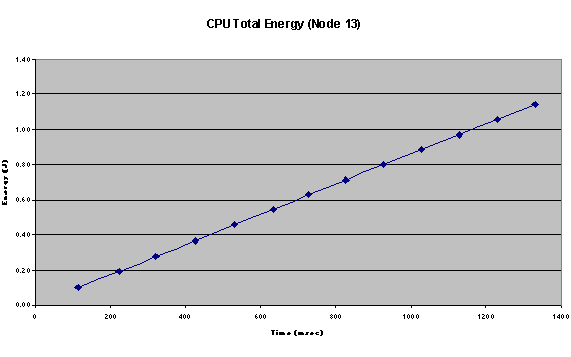
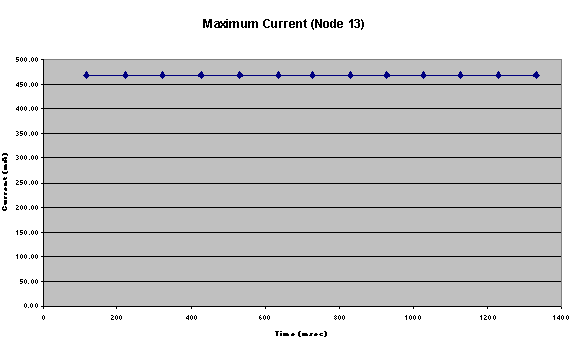
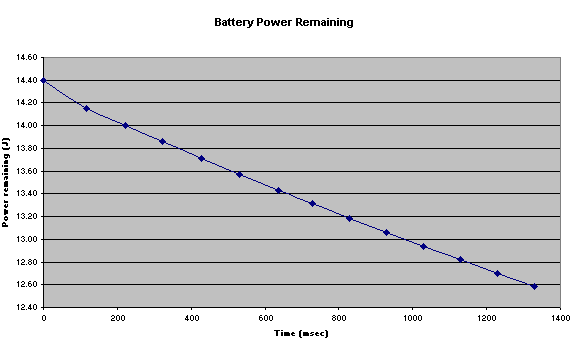
Results and StatisticsThe results are shown in the Figures 2 to 5.Figure 2 shows the time taken for each node to form the ID map. We can observe that the nodes at the corners typically take the longest time to form the ID map, whereas the center nodes takes the shortest time. Figure 3 to 5 show the power consumption charts, i.e. the energy
the CPU uses, the battery drainage and the maximum current. These
are preliminary power statistics.
Next phaseIn the final phase, we will continue to tune the parameters if we manage to get the simulator to run properly. Following that, we will obtain power statistics to compare different routing schemes. We will compare the Ring algorithm against the flooding algorithm in the ID map formation step. We will also compare the Fixed routing algorithm against the flooding algorithm in the sending of sensor data step.If time permits, we will also look at fault tolerance. For example, we could disable one node and see how the image will form. Currently, a node will not start sending sensor data until it has form the ID map completely. We can change this criterion such that it can start sending data even when its ID map has not formed completely, due to faulty nodes.
ConclusionIn conclusion, we have successfully implemented the fixed routing algorithm for the sending of sensor data. We have tried to tune some of the system parameters to make the image array runs better. We also tried to determine a suitable sensor data rate. However, we have not been able to conclude on a data rate due to some problem we had with the simulator. We have also collected some preliminary power statistics.
References[1] “A Survey of Technologies for Smart Fabrics(Computational Textiles), DRAFT, Summer 2001”, Phillip Stanley-Marbell[2] “Project proposal, E-Textile-based Ultra-sound Imaging Array”, Seng Teck, Sing & Chee Wan, Teng [3] “Project Report Phase 1, E-Textile-based Ultra-sound Imaging Array”, Seng Teck, Sing & Chee Wan, Teng [4] “Project Report Phase 2, E-Textile-based Ultra-sound Imaging Array”, Seng Teck, Sing & Chee Wan, Teng [5] “Project Report Phase 3, E-Textile-based Ultra-sound Imaging Array” [6] “Myrmigki Simulator Manual, Release 0.1.ece743”, Philip Stanley-Marbell. |
|||||||||||||
|
||||||||||||||
