Performance Graphs
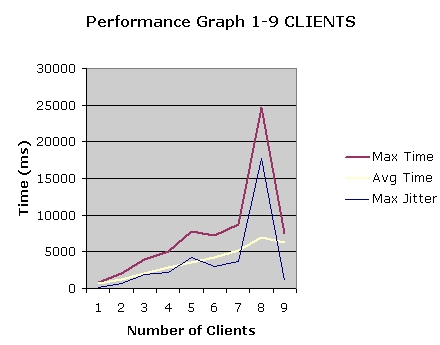
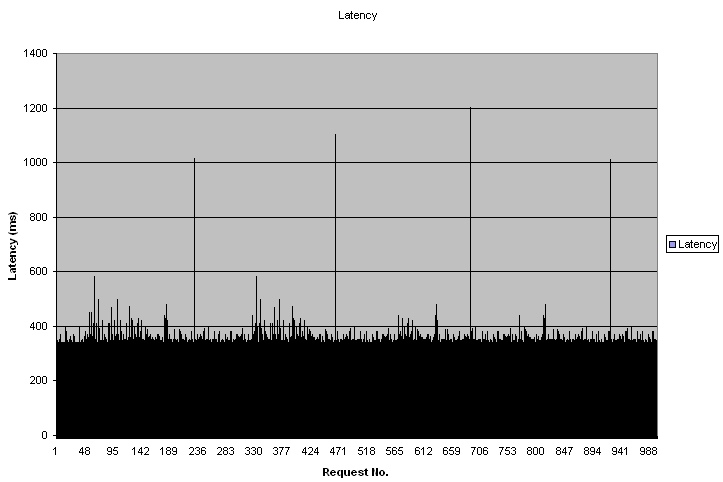
The following graphs shows the Latency for request to our application server.
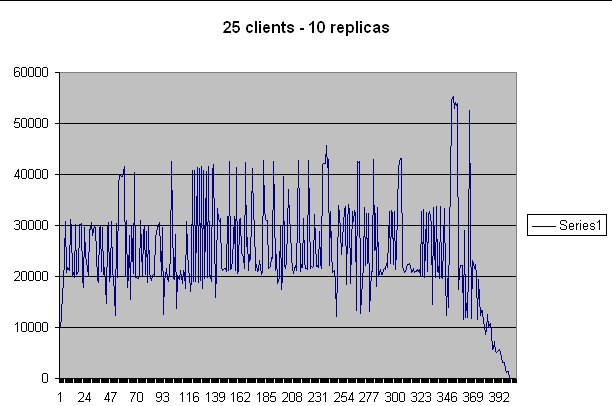
We witness a spike in our system on a periodic cycle
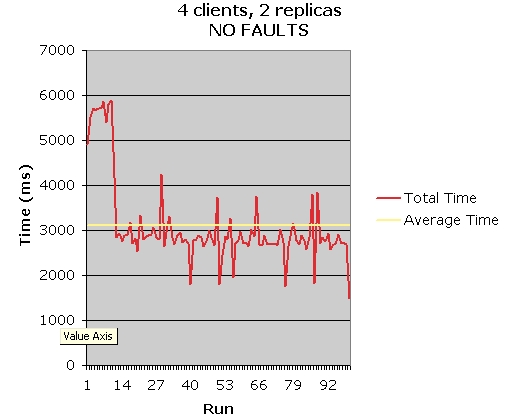
We did a couple test to understand why this spike was occuring and we discovered that the spikes were do to the Java Garbage collection. When we slowed down the request rate the periodic spikes spread out across the request. As you can see below, the spikes will spread out as we decrease the request rate to the application center.
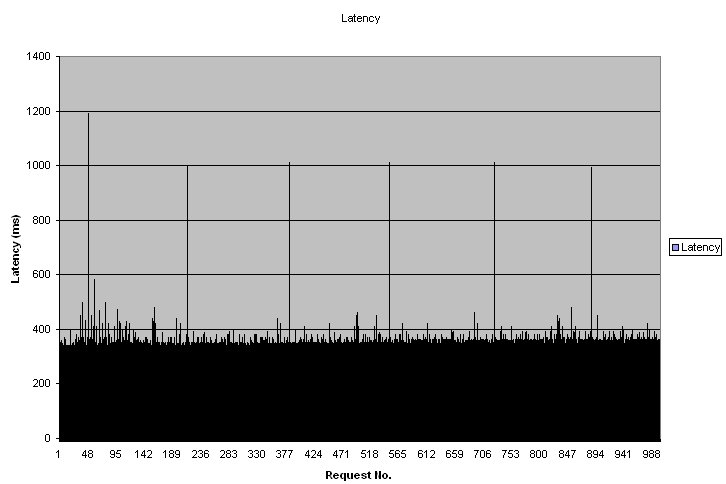
Every 165ish request we see a spike. Request back to back from the client
Every 165ish request we see a spike. Request back to back from the client
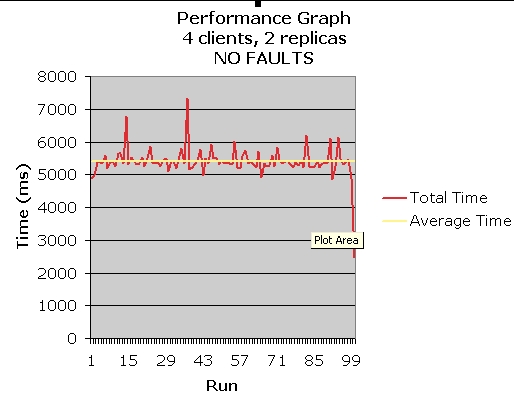
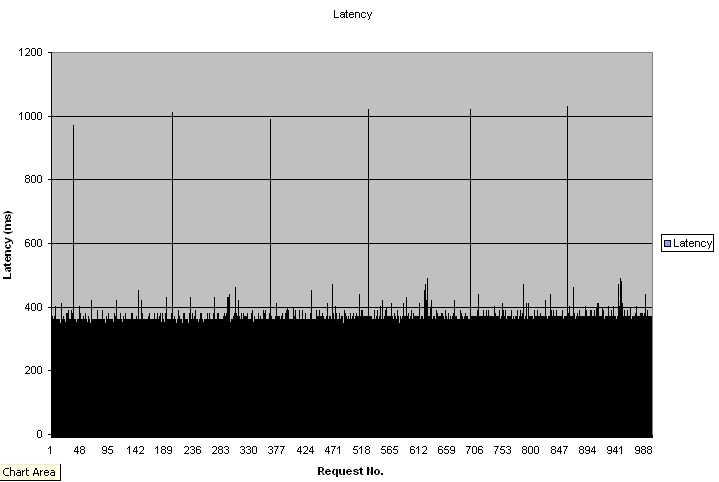
Every 200ish request we see a spike. Request with 1sec wait between request
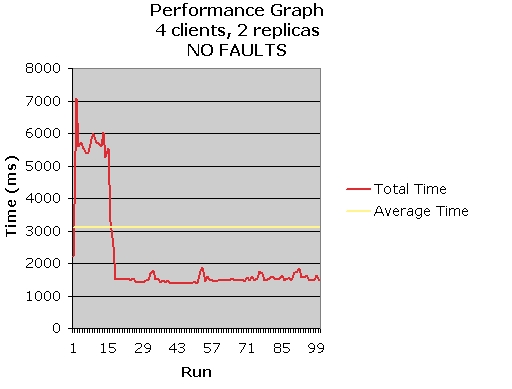
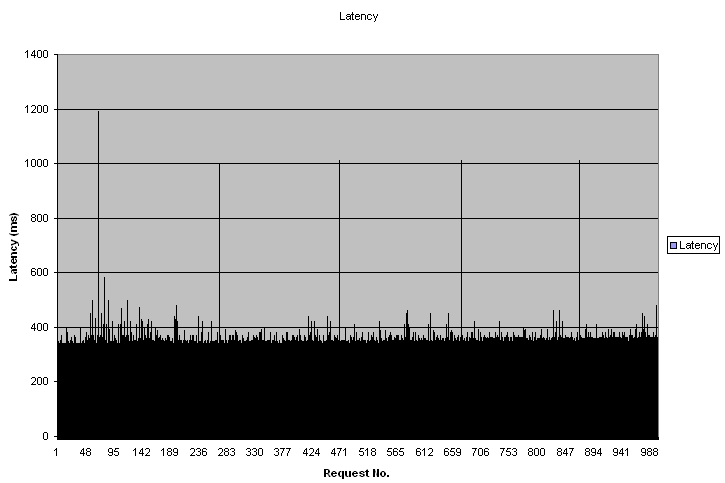
Every 230ish request we see a spike. Request with 2sec wait between request